3-Dimensional Graphs
How do you display a function of two variables?
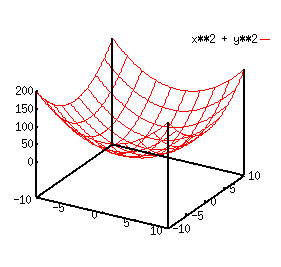
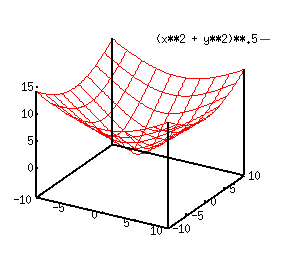
Three dimensional graphs of functions of two variables should be the best way
to convey the behaviour of such functions:


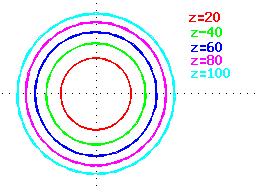
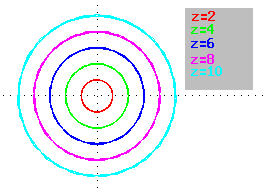
However, sometimes that does not catch the essence you are looking for. In
such cases, another mode of display, perhaps contour diagrams, is more
appropriate.


What are the advantages/disadvantages of each representation?
return to Calculus page
campbell@math.uni.edu
http://www.math.uni.edu/~campbell


