0.1 Alternative definition of the mean
It is useful to present an alternative formulation of the
definition of the mean (which is also valid for the variance and standard
deviation; i.e., s2 and s, not s2 and s). The usual
definition can be rewritten:
|
|
_
x
|
= (1/n) |
ĺ
| xi = |
ĺ
| (1/n) xi |
|
in the latter form the mean of the data set
{ 2, 7, 4, 9, 4, 3, 6, 3, 7 } is
|
(1/9) 2 + (1/9) 7 + (1/9) 4 + (1/9) 9 + (1/9) 4 + (1/9) 3 + (1/9) 6 + (1/9) 3 + (1/9) 7 |
|
which we can rewrite as
|
(1/9) 2 + (2/9) 3 + (2/9) 4 + (1/9) 6 + (2/9) 7 + (1/9) 9. |
|
Instead of multiplying each datum by (1/n), we multipy each value
taken by the data set by the fraction of the time it occurs. In summation
notation this formula is
where the xi are the different values taken by the data set rather than
different points in the data set, pi ł 0, and ĺpi = 1. In this
notation the variance is s2 = ĺpi(xi - [`x])2.
0.2 Histograms and summary statistics
The construction of histograms entails grouping data together into classes for
better visual presentation. This grouping loses some of the original
information, specifically the values of data are replaced by ranges within
which the values lie. It is not possible to find the mean or median of the
data which provided a histogram, but a ``best'' estimate for the mean or
median can be calculated, and bounds on where the mean or median can be are
obtainable. The ``best'' estimates are obtained by assuming that the data is
uniformly spread within each class.
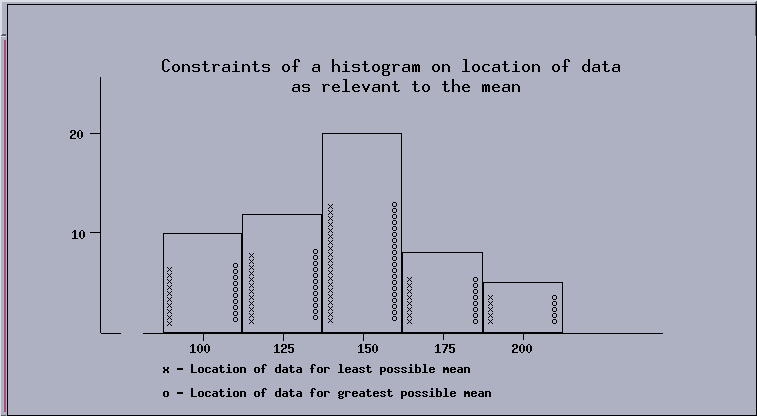
Example: Consider a histogram which has 10 data in the class
with class mark 100, 12 data in the class with class mark 125, 20 data in the
class with class mark 150, 8 data in the class with class mark 175, and 5 data
in the class with class mark 200. What can you say about the mean and median
of the data?
The ``best'' estimate for the mean is obtained by assuming the data is
uniformly spread within each interval; for purposes of calculating the mean,
this is equivalent to assuming that all the data lie on the class marks. In
this example the ``best'' estimate for the mean is
|
m = |
10 ×100 + 12 ×125 + 20 ×150 + 8 ×175 + 5 ×200
55
|
= 143 |
7
11
|
. |
|
In order to get bounds on the mean, it is necessary to know the class
boundaries, which are halfway between the class marks. Adding or subtracting
(25/2) = 12.5 from the class marks provides the class boundaries 87.5, 112.5,
137.5, etc. The least possible mean would occur if all of the data in each
class were at the lower class boundary. In this example the least possible
mean is
|
m = (10 ×87.5 + 12 ×112.5 + 20 ×137.5 + 8 ×162.5 + 5 ×187.5)/55 = 131+(3/22). |
|
Similarly, the greatest possible value for the mean is 156+(3/22).
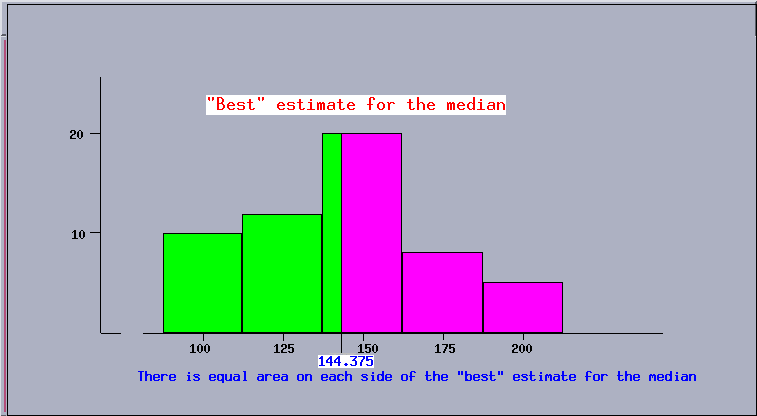
The median is the middle value; uniformly spread data will provide that the
area of the histogram on each side of the median will be equal. The total area
of this histogram is
10 ×25 + 12 ×25 + 20 ×25 + 8 ×25 + 5 ×25 = 55 ×25 = 1375. Of this sum, 250 comes from the
first class, 300 comes from the second class, hence
(1375/2) - 550 = 137.5 is needed from the third class to account for half the area. The area
137.5 is obtained from the third class by going (137.5/20) = 6.875
into it. The ``best'' estimate for the median is 144.375, which provides
equal area in the histogram on either side of it. Since there are 55 data,
the median is the value of the 28th in rank order. This datum will
lie in the third class, which contains the 23rd through 42nd
data. It is possible that all (most) of the data in the third class would be
at the bottom or top of that class, hence the actual value of the median can
be anywhere in the range 137.5 to 162.5.
0.3 Other statistics
There are many other statistics which are used. Two which denote relative
position which are often encountered are the rank and the z-score. The
rank is just what you are familiar with as class rank: it gives the
position among the other data, but no raw score. The z-score measures
how far a datum is from the mean in terms of standard deviation units.
Specifically, zi = [(xi - [`x])/( s)] . The z-score is a
measure of relative position.
Example: If a set of data has mean [`x] = 7 and standard
deviation s = 4, what is the z-score corresponding to x = 5? The
z-score is (5-7)/4 = -.5.
0.4 Exercises
- The weights of students in a class are 130, 154, 210, 190, 200, 106,
180, 160, 125, 185, 210, 128, 150, 120, 150, 120, 140, 195, 235, 180, 148,
115, 155, 190, 126, 125, 125, 170, 140, 110, 148, 185, 120, 230, 190, 170,
135, 175, 168, 140, 202, 190, 120, 125, 167, 134, 200, 117, 160, 170, 180,
170, 190, and 120 pounds. Display this information in a histogram. Why did
you choose your class marks? Why did you label it the way you did?
- The heights of students in a class are 67, 68, 70, 72, 75.5, 63, 69,
71, 63, 70, 73, 69, 70.5, 64, 73, 63, 68, 77, 74, 71, 66.5, 67, 74, 76, 67,
63, 67, 68, 69, 66, 63, 74, 67, 69, 74, 74, 64, 72, 72, 69, 70, 73, 62, 64,
69, 68, 73.5, 64, 72, 73, 72, 71, 75, 66, 64.5, and 68 inches. Display this
information in a histogram. Why did you choose your class marks? Why did you
label it the way you did?
- Give the mean, median, standard deviation, first quartile, third
quartile, and inter-quartile range for the weights in problem 1.
- Give the mean, median, standard deviation, first quartile, third
quartile, and inter-quartile range for the heights in problem 2.
- If 10% of the marbles in a jar weigh .4 ounces each, 30% weigh .5
ounces each, 40% weigh .6 ounces each, and 20% weigh .7 ounces each; what
are the mean and median weight? What are the standard deviation and
inter-quartile range?
- If a class has several people between 60 and 78 inches tall, and one
midget who is 36 inches tall, which average (mean, median, or midrange) will
have the lowest value? Which average will have the highest value?
- Why would you expect the mean income of students in your class to be
greater than the median? Why would you expect the mean age of students in
your class to be higher than the median?
- Consider a histogram with 2 data in the class 7.5 - 12.5, 5 data in
the interval 12.5 - 17.5, and 4 data in the class 17.5 - 22.5. What is the
best estimate for the mean, and what do you know for certain about the mean?
What is the best estimate for the median, and what do you know for certain
about the median?
- For the data in problem 1, what are the z-scores corresponding to the
weights 130, 154, and 210 pounds?
- For the data in problem 2, what are the z-scores corresponding to the
heights 60, 72, and 76 inches?
File translated from TEX by TTH, version 1.56.